The following is a guest article written by Vladimir Mihailenco from Uptrace.
Monitoring Go Apps with Distributed Tracing and OpenTelemetry
What is tracing?
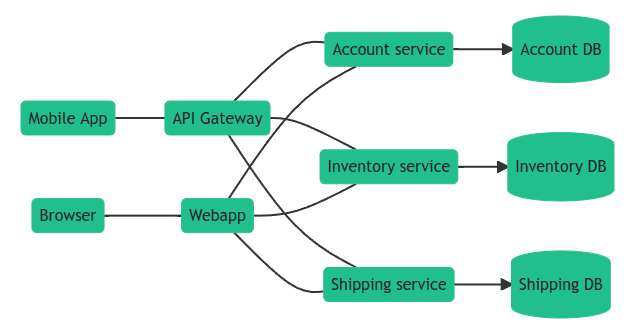
Distributed tracing allows to precisely pinpoint the problem in complex systems, especially those built using a microservices architecture.
Tracing allow to follow requests as they travel through distributed systems. You get a full context of what is different, what is broken, and which logs & errors are relevant.
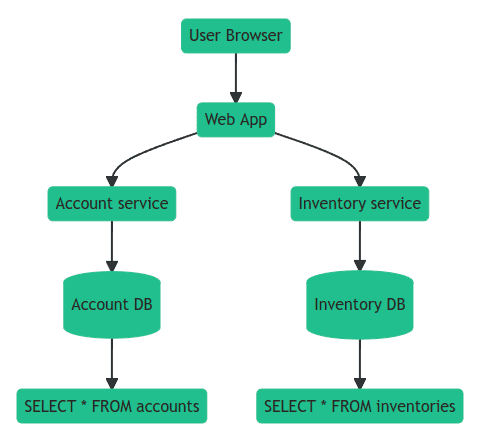
Using tracing, you can break down requests into spans. A span is an operation (unit of work) your app performs handling a request, for example, a database query or a network call.
A trace is a tree of spans that shows the path that a request makes through an app. The root span is the first span in a trace.
To learn more about tracing, see Distributed tracing using OpenTelemetry.
What is OpenTelemetry?
OpenTelemetry is an open-source observability framework for distributed tracing (including logs and errors) and metrics.
Otel allows developers to collect and export telemetry data in a vendor agnostic way. With OpenTelemetry, you can instrument your application once and then add or change vendors without changing the instrumentation, for example, here is a list popular DataDog alternatives that support OpenTelemetry.
How to use OpenTelemetry?
OpenTelemetry is available for most programming languages and provides interoperability across different languages and environments.
You can get started with OpenTelemetry by following these 5 steps:
Step 1. Install a distributed tracing tool.
Step 2. Browse OpenTelemetry instrumentations to find examples for your framework and libraries.
Step 3. Configure the OpenTelemetry SDK to export telemetry data to the tracing tool.
Step 4. Learn about OpenTelemetry Tracing API for your programming language to create custom instrumentations.
Step 5. Install OpenTelemetry Collector to gather infrastructure metrics.
OpenTelemetry Go API
You can create spans using OpenTelemetry Go API like this:
import "go.opentelemetry.io/otel"

var tracer = otel.Tracer("app_or_package_name")

func someFunc(ctx context.Context) error {
	ctx, span := tracer.Start(ctx, "some-func")
	defer span.End()

	// the code you are measuring

	return nil
}
You can also record attributes and errors:
func someFunc(ctx context.Context) error {
	ctx, span := tracer.Start(ctx, "some-func")
	defer span.End()

	if span.IsRecording() {
		span.SetAttributes(
			attribute.Int64("enduser.id", userID),
			attribute.String("enduser.email", userEmail),
		)
	}

	if err := someOtherFunc(ctx); err != nil {
		span.RecordError(err)
		span.SetStatus(codes.Error, err.Error())
	}

	return nil
}
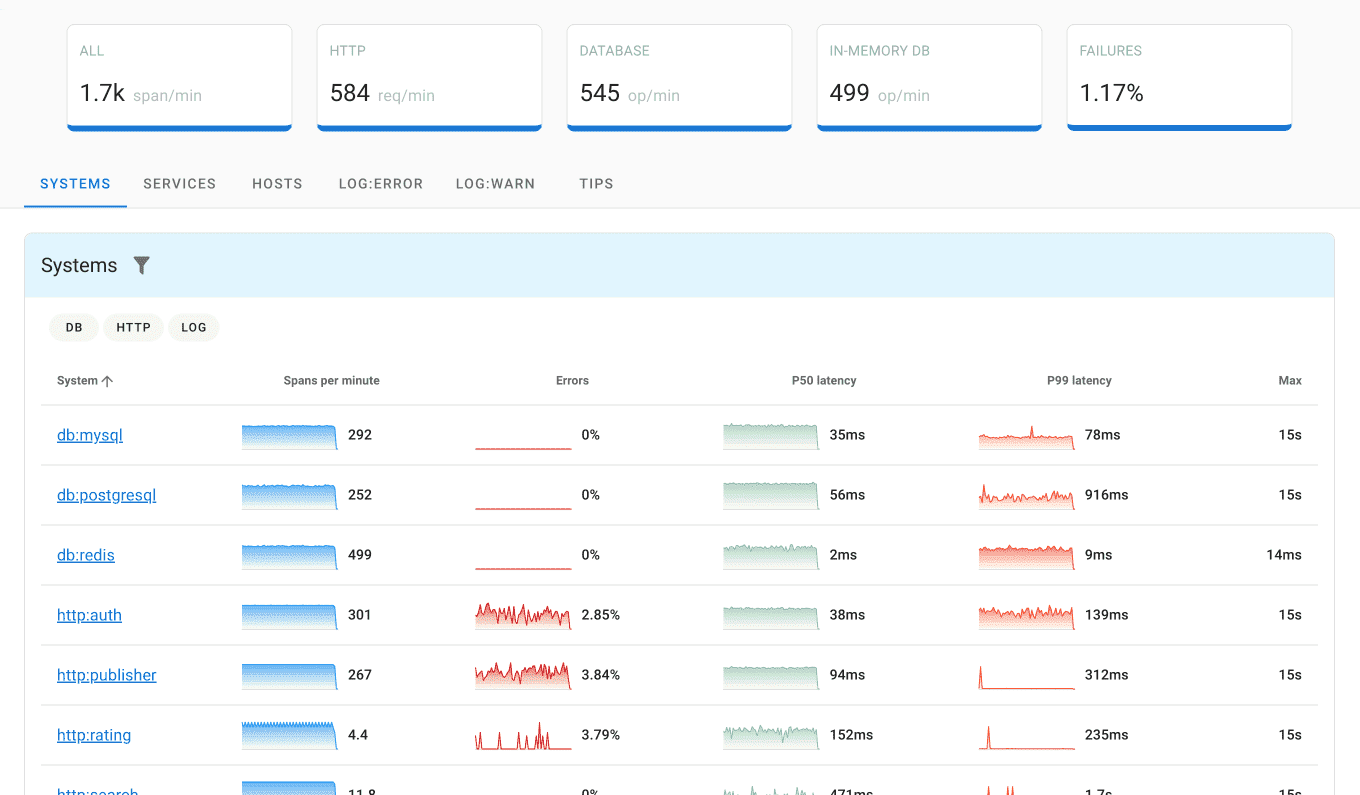
What is Uptrace?
Uptrace is an open source DataDog alternative that helps developers pinpoint failures and find performance bottlenecks. Uptrace can process billions of spans on a single server and allows to monitor your software at 10x lower cost.
Uptrace accepts data from OpenTelemetry and stores it in a ClickHouse database. ClickHouse is a columnar database that is much more efficient for traces and logs than, for example, Elastic Search. On the same hardware, ClickHouse can store 10x more traces and, at the same time, provide much better performance.
You can install Uptrace by downloading a DEB/RPM package or a pre-compiled binary.
What’s next?
Next, you can continue exploring OpenTelemetry or start instrumenting your app using popular instrumentations: